What is Net Revenue Retention (NRR)? How is It Calculated for D2C Brands
The Metric That Reveals If Your Brand Is Actually Growing
Most D2C founders measure growth using GMV or new customer count.
Both can lie.
You can grow GMV while losing money on every customer. You can grow new customer count while your existing base is collapsing. These metrics tell you what is happening on the surface, not whether your business is fundamentally healthy.
The metric that tells you the truth is Net Revenue Retention.
NRR is the SaaS world's gold standard for measuring business quality. In D2C it is still rare, which is exactly why the founders who track it have an advantage. This blog explains what NRR is, how to calculate it correctly for an e-commerce business, what benchmarks to aim for, and how to improve it.
What Is Net Revenue Retention
Net Revenue Retention measures how much revenue you keep from a fixed group of customers over a defined time period, accounting for upgrades, downgrades, and churn.
In plain language: take 100 customers from January. Look at the same 100 customers in December. How much revenue did they generate this year compared to last year?
If they generated more, NRR is above 100 percent. Your existing customers are growing without you adding new ones.
If they generated less, NRR is below 100 percent. Your customer base is shrinking on a revenue basis even if your top-line looks fine.
NRR is the single best measure of how much your existing customers love your brand, expressed as a number.
The NRR Formula for D2C Brands
The standard SaaS NRR formula needs adjustment for D2C because there is no subscription.
The D2C-friendly version:
NRR = (Starting Revenue + Expansion Revenue - Contraction Revenue - Churned Revenue) / Starting Revenue × 100
Breaking down each term for D2C:
Starting Revenue: Revenue from a defined customer cohort in period 1 (for example, all customers who bought in January).
Expansion Revenue: Additional revenue from those same customers in period 2 through repeat orders, higher AOV, or category expansion.
Contraction Revenue: Revenue lost because those customers spent less than before (lower AOV or fewer orders).
Churned Revenue: Revenue lost because those customers stopped buying entirely.
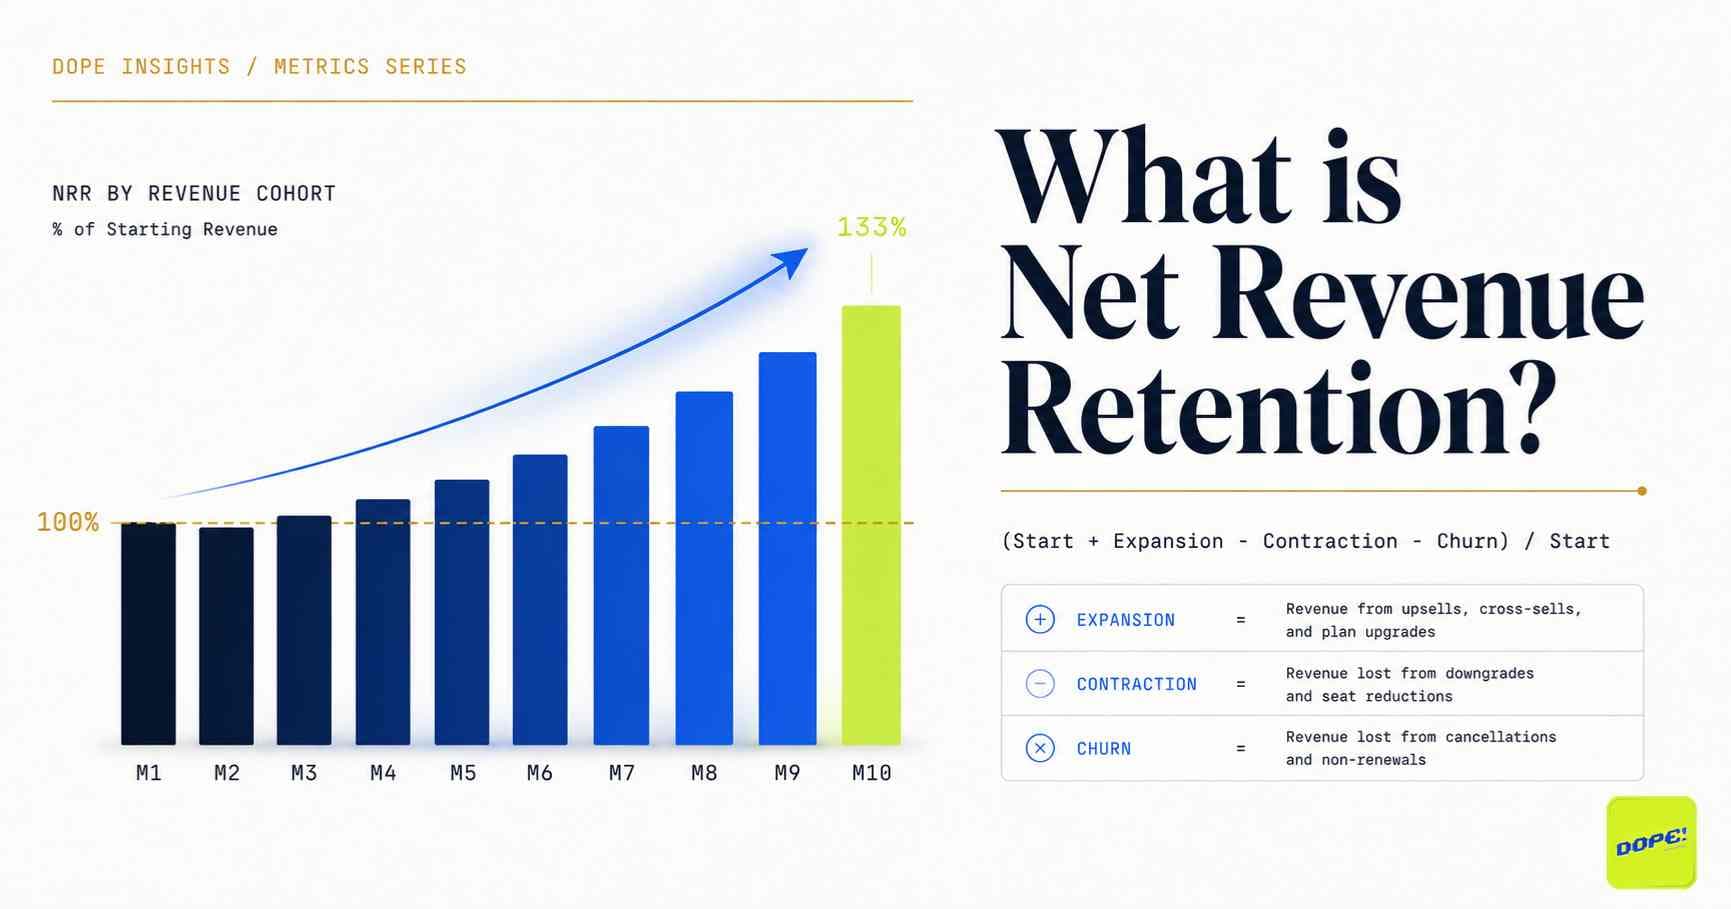
A Worked Example
Take 100 customers who bought from your brand in January 2025. Each spent an average of Rs 1,500, generating Rs 1,50,000 in starting revenue.
Twelve months later, in January 2026, here is what happened to those same 100 customers:
40 customers reordered multiple times, generating Rs 90,000 in expansion revenue
25 customers reordered once, generating Rs 30,000 in steady revenue
15 customers reordered once but at lower AOV, generating Rs 12,000 but representing Rs 10,500 in contraction
20 customers never came back, representing Rs 30,000 in churned revenue
Calculation:
NRR = (1,50,000 + 90,000 - 10,500 - 30,000) / 1,50,000 × 100
NRR = 1,99,500 / 1,50,000 × 100
NRR = 133 percent
This brand has excellent NRR. The same 100 customers grew their spend by 33 percent year over year.
Now flip the example. If only 15 customers reordered and 60 churned:
NRR = (1,50,000 + 20,000 - 5,000 - 80,000) / 1,50,000 × 100
NRR = 85,000 / 1,50,000 × 100
NRR = 57 percent
This brand is in trouble. The customer base lost 43 percent of its revenue power in 12 months, regardless of how many new customers were acquired.
NRR Benchmarks for D2C Brands
Unlike SaaS, D2C does not have widely published NRR benchmarks. Based on category patterns:
Below 60 percent: Severe retention problem. Brand is on an acquisition treadmill. Unsustainable.
60 to 80 percent: Below industry health. Most Indian D2C brands sit here.
80 to 100 percent: Healthy. Customers are maintaining their spend or close to it.
100 to 120 percent: Strong. Existing customers are growing their spend, expansion outpaces churn.
Above 120 percent: Exceptional. You have a real D2C brand with compounding customer value.
The brands that hit above 110 percent NRR are the ones that can grow without continuously increasing ad spend. They are the brands investors actually want to back.
Why NRR Is a Better Health Check Than Repeat Purchase Rate
Repeat purchase rate tells you how many customers came back. NRR tells you how much revenue came back.
These are different.
A brand with 30 percent repeat rate but high-value repeat orders can have NRR of 110 percent.
A brand with 50 percent repeat rate but smaller follow-up orders and downgrades can have NRR of 75 percent.
NRR captures the full picture. It accounts for:
Customers who came back and spent more (expansion)
Customers who came back and spent less (contraction)
Customers who left entirely (churn)
The actual revenue impact of each behaviour
This is why investors increasingly ask D2C brands for NRR before they ask for GMV growth.
The Four Levers That Move NRR
NRR has four input variables. Improving any one of them lifts NRR. Improving all four compounds.
Lever 1: Reduce Churn
The biggest drag on NRR. Every churned customer is a full revenue loss with no offset.
Actions:
Detect at-risk customers in real time, not after they have left
Solve issues within 48 hours of detection
Build a recovery system for customers who have not reordered in 1.5x their normal cycle
Lever 2: Reduce Contraction
The silent NRR killer. Customers who spend less without leaving entirely.
Actions:
Identify customers whose order value or frequency is dropping
Find out why through direct outreach, not assumptions
Re-engage them with relevant offerings before their behaviour solidifies
Lever 3: Drive Expansion Through AOV
Existing customers spending more per order.
Actions:
Use customer feedback to identify expansion-ready segments
Cross-sell based on stated preferences, not algorithmic guesses
Launch premium SKUs to high-trust customers first
Lever 4: Drive Expansion Through Frequency
Existing customers buying more often.
Actions:
Reduce reorder friction (one-tap WhatsApp reorder beats web checkout)
Time outreach to reorder cycle
Build replenishment habits in subscription-friendly categories
Why Most Brands Cannot Track NRR Properly
Three reasons:
Data fragmentation. Order history is in Shopify. Sentiment is in Google Reviews. Support data is in your helpdesk. Customer feedback is in WhatsApp screenshots. No one merges this.
Cohort tracking complexity. NRR requires tracking the same group of customers over time. Most analytics tools track aggregate metrics, not cohort-level retention.
Lack of upstream signals. NRR is a lagging metric. By the time you see it drop, the damage is months old. You need upstream signals (sentiment, complaints, response patterns) to predict it.
This is why even brands that want to track NRR rarely do so consistently.
Where DOPE Fits Into NRR Improvement
NRR is driven by your ability to detect, diagnose, and act on customer behaviour changes before they show up in revenue.
DOPE is built exactly for this layer.
How DOPE directly improves NRR:
Cohort-level customer intelligence. Track sentiment, behaviour, and feedback by customer cohort, not just at aggregate level.
Churn risk signals. At-risk customers flagged before they stop buying, giving you time to act on the largest NRR drag.
Contraction detection. Customers whose engagement or sentiment is dropping surface in your dashboard, so you can intervene before contraction becomes churn.
Expansion opportunity surfacing. Champions and high-trust customers identified for premium SKU launches and cross-sell campaigns.
Real-time Trust Score. A single number that moves with NRR. When trust climbs, NRR climbs with a lag of 60 to 90 days. You see the future before it shows up in revenue.
Theme-level intelligence. Know which themes (delivery, packaging, product, support) are pulling NRR down and fix them specifically.
You stop tracking NRR retrospectively. You start improving it deliberately.
What to Do This Week
Pick a customer cohort from 12 months ago. Pull their starting revenue from Shopify.
Pull their revenue over the last 12 months. Calculate NRR using the formula above.
Compare against the benchmarks. Understand where your brand sits.
Break down which of the four levers (churn, contraction, AOV expansion, frequency expansion) is your biggest gap.
Set a 12-month NRR target. Make it the single metric your team aligns around.
NRR is the metric that reveals the truth about your brand. Top-line growth can be bought. NRR cannot. The brands that win in Indian D2C are the ones that build NRR like an asset and protect it like one.
Track and grow NRR with confidence.
DOPE is India's first multi-channel customer intelligence platform built for D2C brands. We surface the upstream signals that drive NRR, flag churn and contraction risk in real time, and help you build the customer base that grows itself.
Apply for the DOPE Intelligence Grant: 20 free credits, full setup by our team, zero commitment.
dope.scanmonk.com | Book a demo | Apply for grant